Synapse helps manufacturers reduce costs by speeding up problem awareness

Example of the final product on different devices.
Results
For the company: $150,000 USD on pre sales using high fidelity prototypes.
For our customers: Up to 50% reduction in response time.
Tools & frameworks
Qualitative research.
Design thinking.
Wireframing.
Prototyping.
Product analytics implementation.
My role
Co-founder & product designer.
Quick links
To see a video of the high fidelity prototype click here.
To see a walkthrough of the launched product click here.

General information

Manufacturing companies in Mexico are losing thousands of dollars each month because of the long response time to solve daily problems that stop their production lines.

The problem

99% of factories in Mexico have their manufacturing machines and software tools disconnected from each other, generating data silos and slowing down problem awareness and response time.

Solution

Eliminate these data silos so information can flow between departments to speed up problem awareness and solutions. To accomplish this goal, we developed a Device + App + APIs to collect data in real-time from any manufacturing machine and software to sync production data across the entire factory.

Objective & role

As Co-founder and product designer at D&D Labs, I was responsible for researching and identifying problems that replicate across our customer base and target market. To accomplish this goal, I focused on qualitative research, prototyping, and validating new features.

Discovery

Understand the problem

The first step was to get a deep understanding of why manufacturing companies were having slow response time. The goal we established was to identify the most recurring and time consuming problems that slowed or stopped the production lines. To understand this my team and I settled on three qualitative research techniques to answer the following questions.

1 to 1 interviews
Interview experts
Secondary research
Questions to answer.

Careful with biases

Because we already had customers, and talked to them on a daily basis. We already had heard about some of the problems they were facing and naturally each member of the team already had an idea of how to solve them. So we needed to be extra careful about confirmation biases.

How I tried to avoid biases
Something I tried this time to overcome the confirmation bias was to implement a methodology I learned from the book ¨The mom test¨. This approach focuses on creating casual conversations, your goal is to understand the daily life of your customer and don't mention your product at all. I found this method very useful to avoid bad data, fluff, and confirmation biases. 
Example of how confirmation bias affects your research.

Execution & findings

1 to 1 onsite & remote interviews
For the onsite interviews I visited our customer's factories, half of my time was dedicated to talk with our users, the other half to observe and validate if what they told me was true. For the remote interviews I tried to make them as casual as possible but it was harder. The key for me was to prepare a set of 3 questions I wanted to understand and as the interviewee spoke I would make follow up questions to go deeper. 
Interview the experts
One challenge here was to schedule interviews with the correct people. I used my network from college and talked to friends working in the manufacturing industry and asked them for warm intros with their bosses. In the interviews I was focused on understanding the experience of the interviewee, what problems they solved that got them promoted and how recurrent was that problem across the factories they worked on.
Secondary research
My goal here was to identify if the problems that Mexican factories were facing were already solved in other countries. I focused on researching papers and case studies of the manufacturing industry in developed countries like USA, Germany, Japan, China.
Findings
After concluding our research we found out that the number one cause for slow responses time was due to a broke information flow between the shop floor and the rest of the organization. Factories in developed countries addressed the issues by implementing real time production monitoring to help them get reliable data. Now they are focusing on making this data available across their software tools via integrations or custom software development.
Research onsite.

Design process

Empathize

Our goal was to define our end user and other users involved around the problem. This step was very difficult because there were a lot of people involved. To understand this we repeat the same strategy of 1 to 1 interviews we used on the discovery phase.

Findings
Finally we learned that the end user was the production department who were responsible for the efficiency of the manufacturing process, other departments like maintenance, quality assurance, logistics, were users who had indirect influence on the final results of the production process but they were not the owners of these results. 
Example of empathy maps created with our research.

Define

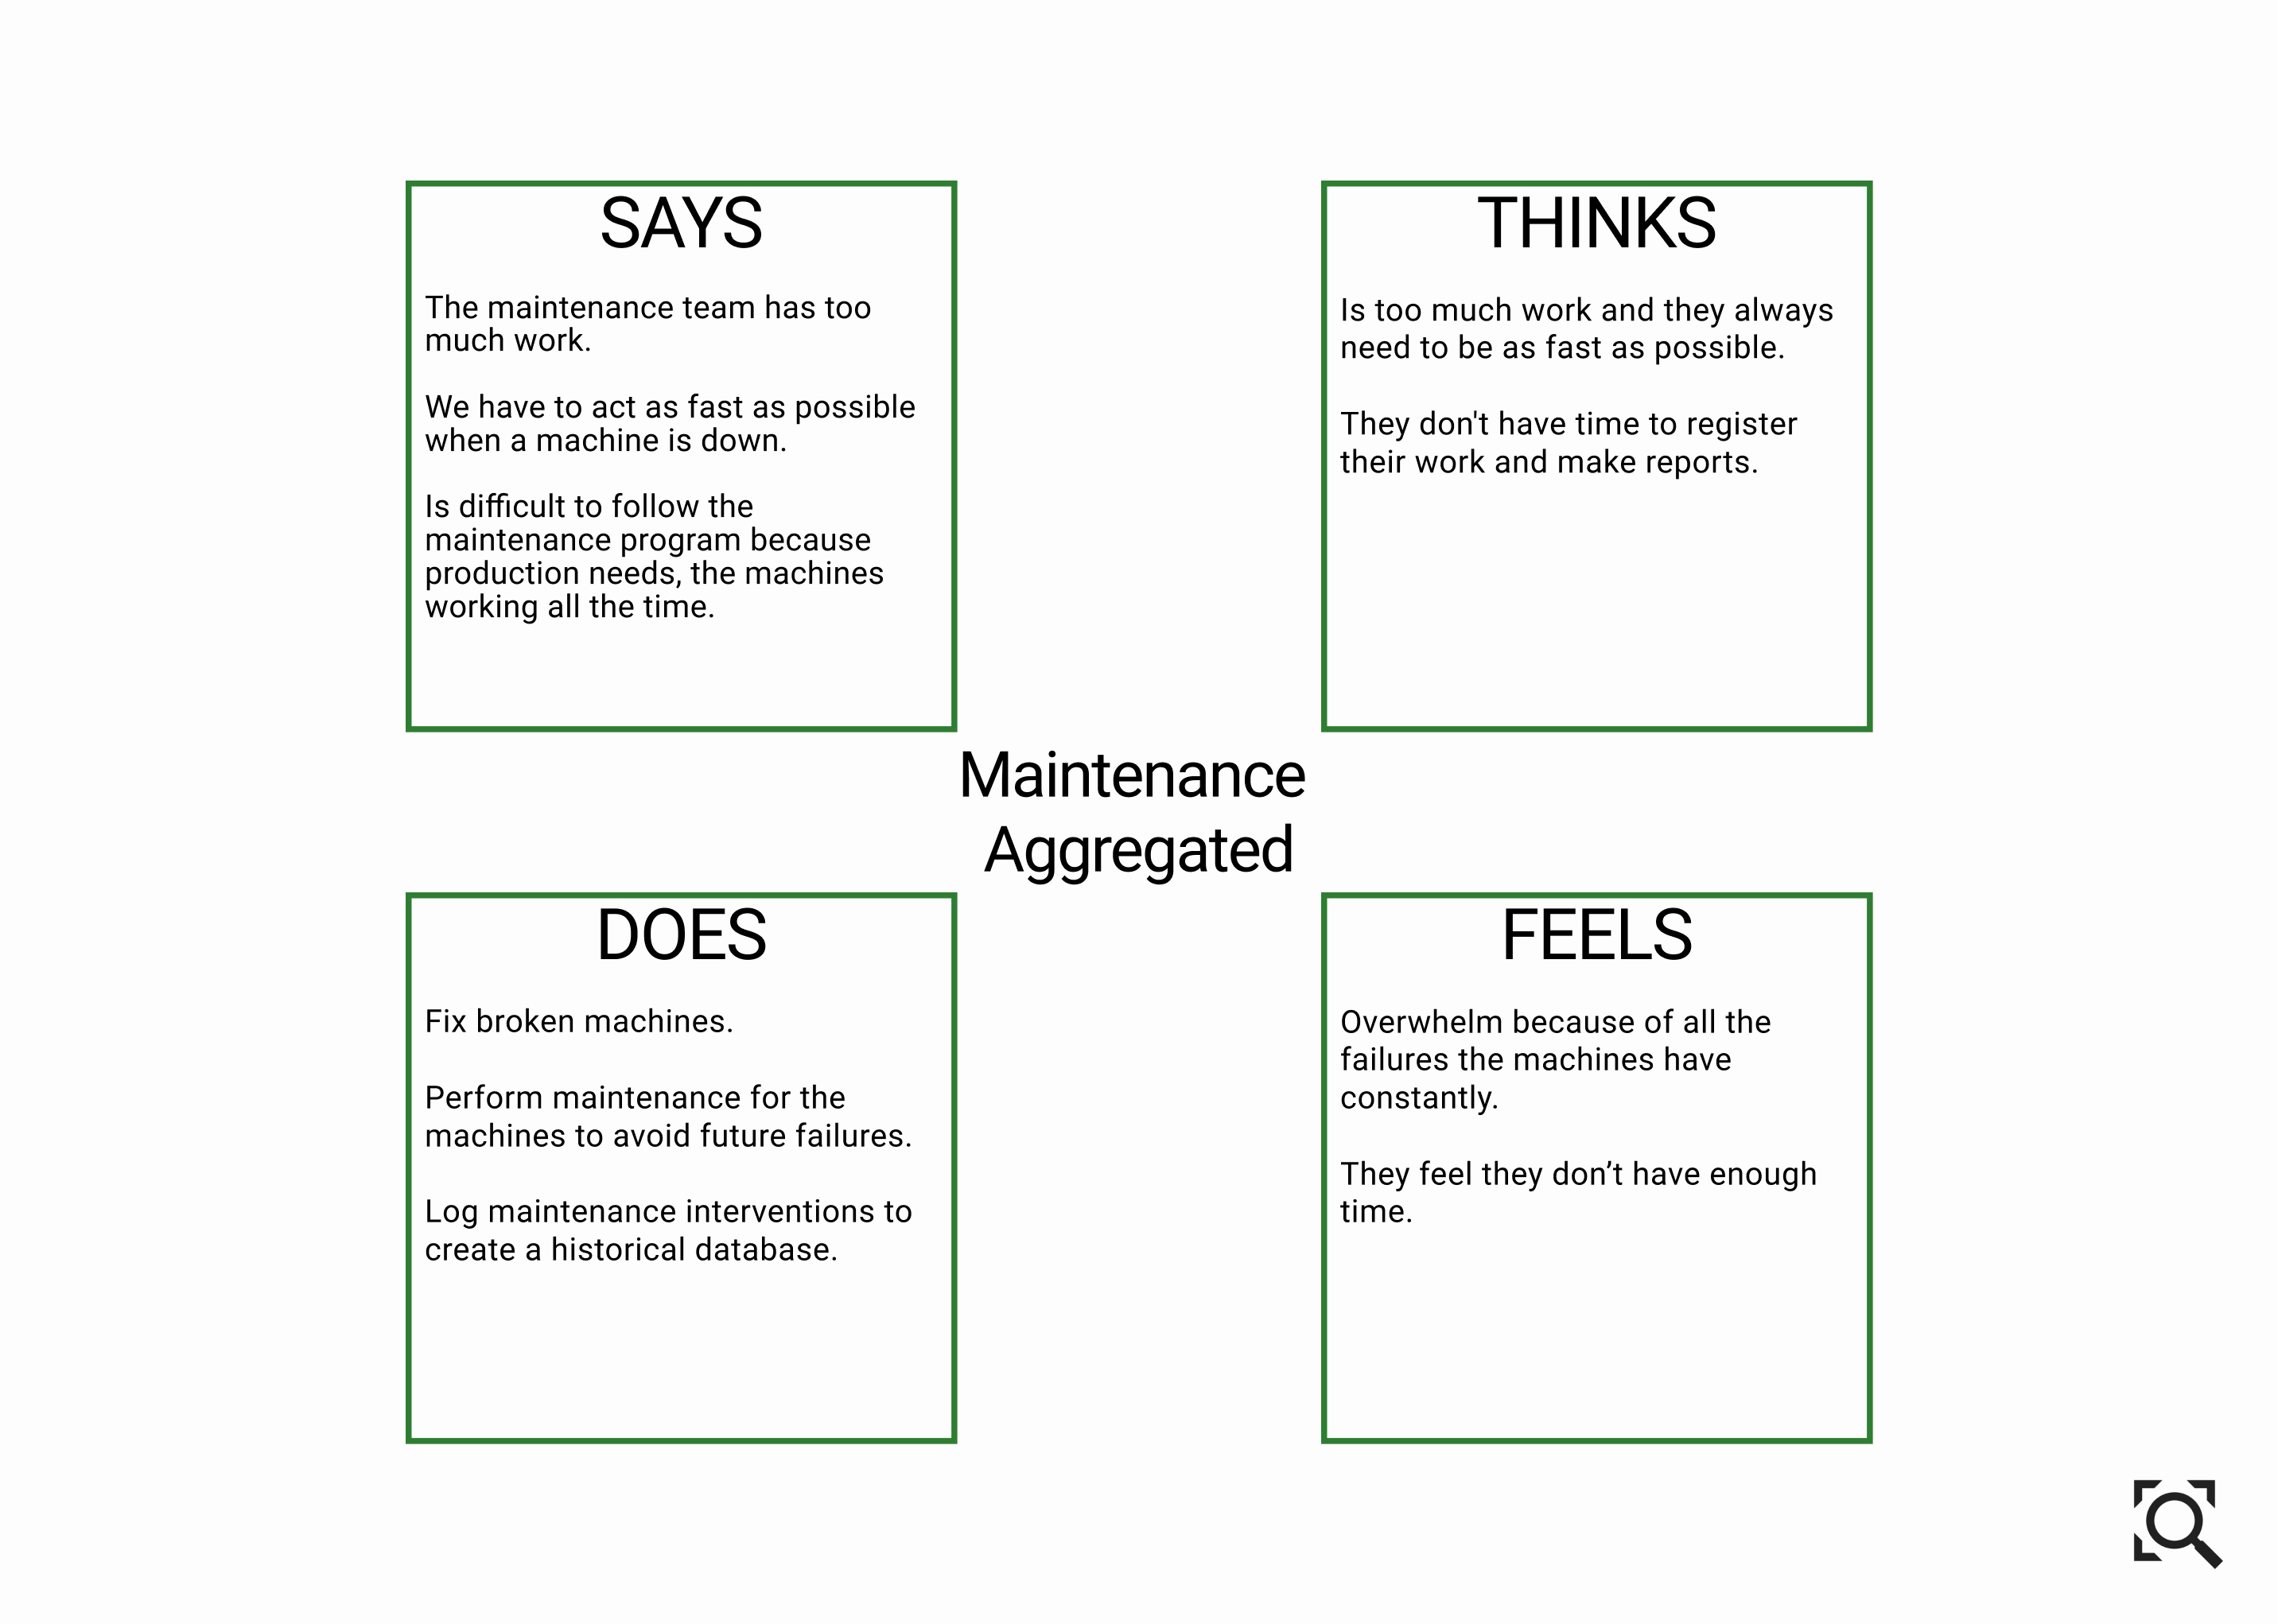
We looked deeper into the production department and we found two key problems.

Findings
The production team needed a way to monitor the efficiency of the machines and get alerted about failures in real time, by doing these they would be able to anticipate problems and respond faster. On the other hand they needed help getting reliable information from other departments in order to make the production plan and iterate it if needed. Key information included inventory updates and machine maintenance programs.
End user persona.

Ideate

Now that we know our end user and their pains, we were ready to think about solutions. We decided to do lightning demos to pump our creativity, make sure we consider every idea and speed up the ideation process.

Results
We settle on a devices that could extract data from the machines in real time and communicate it to a web app were the production team could monitored the progress of their production, be alerted if the machine stopped unexpectedly, subtract raw materials that were used based on the finished parts produced, and log machine and tooling wear based on working time.
Image of the team working on the ideation phase.

Prototype

In the prototyping phase I was responsible for the designing our web app. Because it was a big project I make sure to test the design with real users in every step from initial sketches to final prototype.

Wireframes
I decided to use digital tools to be able to test my wireframes easily. For testing I used 1 to 1 interviews with end users from our customer base. Most of these testers were the same people who helped us before with our research.
Learnings
After testing our wireframes, the biggest concern of our end-user was, "Where is the information about other departments is going to come from?". The answer for us was to motivate other departments to use our app by solving usability problems with their current software tools.
Concerns
At this point, we were starting to get worried about the viability of the product. It was starting to look like an extremely big and difficult product to develop.
Animated example of the wireframes we developed.Animated example of the wireframes we developed.
Examples of the wireframes we developed.
High-fidelity prototypes
High fidelity prototyping was a critical step because we needed to be sure that this was a sellable product before starting the development. We decided to add one business KPI before going to production, "Sales." To continue with the development of the product, we needed to sign two new customers.
Video of our high fidelity prototype.

Prototype testing

Testing the prototype with users
As before, my tools of choice were 1 to 1 interviews and observational testing to see if the product was helping the user to solve their problems and to evaluate if the product was easy to use and navigate.
Using the prototype to sell
I started by creating a database of companies that share some characteristics with the paying customers we already had. I was able to get some emails and phone numbers and I started making cold calls and sending cold emails. The first step in the pipeline was to schedule a demo via videoconference to show our “product” to the new potential customers and understand if they were interested or not and why.
Results
After several demos I noticed that something was going very bad. After the demos with potential customers I only heard fluff, and no concrete next steps. This was extremely alarming because the development of this product was going to take a long time and effort. 
What we missed?
After some more demo interviews and pushing the boundaries of the information that I was receiving I finally understood the problem when a potential customer told me:
“We already have software tools that do that. Even though they aren’t in real time, we already invest a lot of money and time implementing these tools and we don’t want to migrate to other ones. Why don’t you make my tools automatic instead? ”

Back to the drawing board

At this point my team and I realized that we made a big mistake, we didn’t need to design a completely new software solution that covered the functionality of other solutions. What we needed to do was to update the information in their existing tools automatically and in real time.

Diagram of the final product functionality.

Shipped product

After this new insight we changed our product to a Device + App + APIs to collect data in real time from any manufacturing machine and software to sync production data across the entire factory and speed up problem awareness.

DEvices
Our device was responsible for machine software communication.
Web App
Our app was to display production information, calculate and log manufacturing KPIs and alert unplanned stops in real time.
API
Our API was to communicate with other software tools and update information bidirectionally.
Video walkthrough of the final product.

Final results

Customer KPI
Up to 50% reductions in response time, based on data shared by our customers and logged by our product.
Business KPI
We managed to pitch and demo the new prototype and sold $150,000 USD pre launch. 
Product
We end up with a product easier to develop and that solves the pains of our users more efficiently because they don't have to stop using the tools they are familiar with.

After launch

After launch, I took the task of designing and implementing the analytics infrastructure that will help us identify future improvements. I decided to implement the following tools.

Mixpanel
Mixpanel to have an overall view of the interactions with the product, like rage clicks, number of sessions, session length.
Fullstory
Fullstory to analyze user interactions by generating automatic and anonymous screen recordings.
Segment
Segment to be able to implement and modify the analytics infrastructure without having to write much code.
Results
Based on the information provided by the analytics tools we identify a lot of rage clicks on a specific screen. By analyzing the screen recordings we saw how the users were interacting and why they were having problems.
Images of the before and after of the operators interface.

Retrospective

This was a very challenging project because of the multiple users and stake holders involved around the problem. The perspective of a person that deals with the problems of the production line on a daily basis was very different from the perspective of a factory manager. Ultimately I think we made the right decision in prioritizing the production team instead of other teams. In my opinion the biggest mistake we made was not to open our research to more factories earlier in the processes.

Biggest chellenge
Multiple users and stakeholders with different perspectives of the problem.
Biggest mistake
We should have open our research to a broader audience earlier.
Best decision
Focus on solving the problems of the end users first.

I'd love to hear from you!

If you found something interesting about my work, have any questions or would like to chat, feel free to contact me through any of these channels. It would be a pleasure to help!

Email
rodolfopenagosruiz@gmail.com
Phone
+52 (33) 2055 2603
linkedin iconInstagram icon.Twitter icon